I’m always looking for ways to make my science more interactive with the public. What better way then to visualise your data and to make them dynamic and playable! I recently found out about Plot.ly, a website that enables you to create very beautiful plots that are fully customisable and embeddable and allow manipulation and interaction from your website visitors.
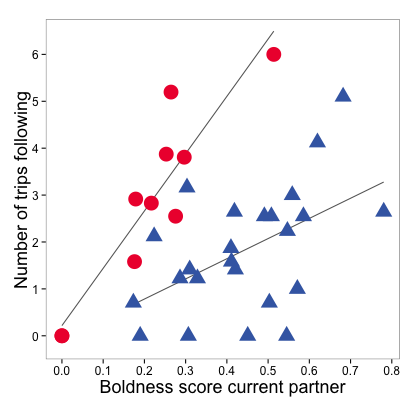
What I particularly like is its link with ggplot2 in R. With some simple lines of code you can easily make a plot you created for your scientific publication interactive and online. As an example, I will create an online interactive version of one of the plots in my recent paper on leadership in sticklebacks:
Here is the online interactive version. Hover over the point and try to drag the plot or zoom in and out:
And here is the original version:

In my follow-up post I will explain how to create such a plot yourself!
Leave a Reply